Internals are showing a rise is expected
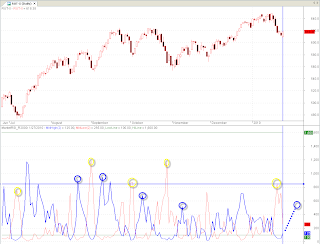
Demonstrated in the charts below is an indiactor which has been good at finding significant market moves. It is a market breadth indicator (MktRSI) which has been applied to the SP-500 ($SPX), Russell 2000 ($RUT) and the Nasdaq 100 ($NDX) seperately. When extremes are noticed in it's values either from the lows (red lines) or the highs (blue/black lines), typically a reflexive move can be seen from the opposite line and usually within a few days of the original move or peak. While it's doesn't show exact tops and bottoms, it finds a majority of stocks moving in that direction, hence the breadth.
This first chart is of the S&P 500, where you can see the thin red line of lows circled in yellow hits an extreme reading (different for each index) and is followed by another extreme reading of the highs (black line for SP-500, blue for the other indicies). The highs are circled in blue. I've included my projections with the dotted blue lines followed by a blue circle. This pattern has shown a high degree or repeatability.
Here's the Russell 2000:


